oVirt Engine Debug Obfuscated UI
Debug Obfuscated UI
Owner
- Name: Alexander Wels (awels)
- Email: awels@redhat.com
Introduction
Sometimes during the usage of the Web admin or User portal you will get a popup about an uncaught exception like this:
Uncaught exception occurred. Please try reloading the page. Details: [some information]
In general this message lets us know something went wrong, but is less than helpful in determining what exactly went wrong. The information provided usually includes some obfuscated code like ‘c is null’ or ‘cannot get field O5d’. None of which is very helpful.
Why is this happening now? Recently we introduced some code that captures all exceptions that are not handled anywhere else, and displays it to the user. Before the un-handled exceptions would be written to the browser console and mostly ignored unless someone looked at the browser console. They are still written to the console, but they are also reported to the user, this has some benefits and some negatives. The benefits include the fact that the user can now report something is going wrong since they are being told. The negatives include the fact that the user sees the fact that something goes wrong and they conclude the product is bad. The developers cannot fix issues they are not aware of, so in the short term we will have more bug reports but in the long term we will have a better product due the more transparent exception reporting.
Debugging steps
Getting the full stack trace from the console
As before the full stack trace is being written to the console, but the user is now aware of it via the pop-up message. To get the full stack trace you can open up the browser console. On most browsers you can start the development tools by pressing CTRL+SHIFT+i.
Once the development tools are open, you can switch to the console tab. Scroll down to where you see the exception as shown in the following diagram:
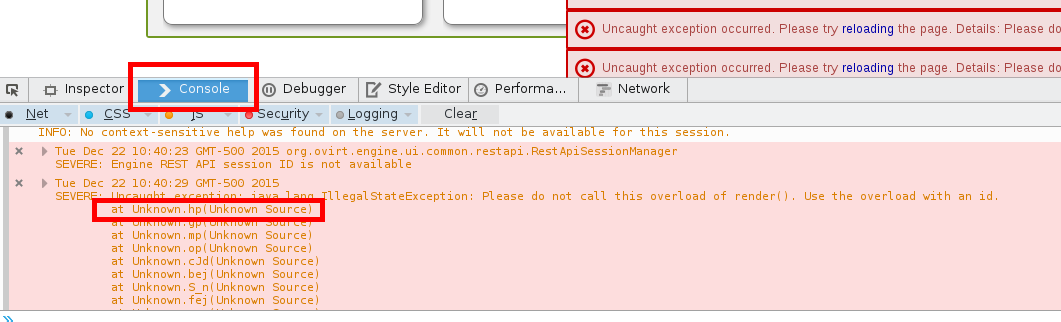
Your exception will be different but the top line as highlighted will be the important one.
Making sure we have the right symbol maps
Now that we have the stack trace and the most likely culprit of the exception, we don’t know what it is. When the UI is built, goes through a process of optimizing and obfuscating the original code. This is done to reduce the download size and optimize the performance of the application. The down side of this is that one can’t easily tell what is going on. During this process another file is generated called a symbol map. This file maps the obfuscated code to the original source code. Due to the size of the file this is not installed by default. To install the symbol maps run the following command as root:
yum install ovirt-engine-webadmin-portal-debuginfo ovirt-engine-userportal-debuginfo
# If you are running rhv
yum install rhevm-webadmin-portal-debuginfo rhevm-userportal-debuginfo
After installing these packages, the engine should be restarted (regardless of whether this is oVirt or RHV)
This will install the symbol maps in /usr/share/ovirt-engine/gwt-symbols/webadmin/symbolMaps and /usr/share/ovirt-engine/gwt-symbols/userportal/symbolMaps. Each directory will contain a bunch of files called <permutation hash>.symbolMap.
determine the permutation you are using
Some browsers will include the permutation file name at the bottom of the exception. If you are lucky enough to have a browser that does that, you can skip this step and use the value from the bottom of the exception.
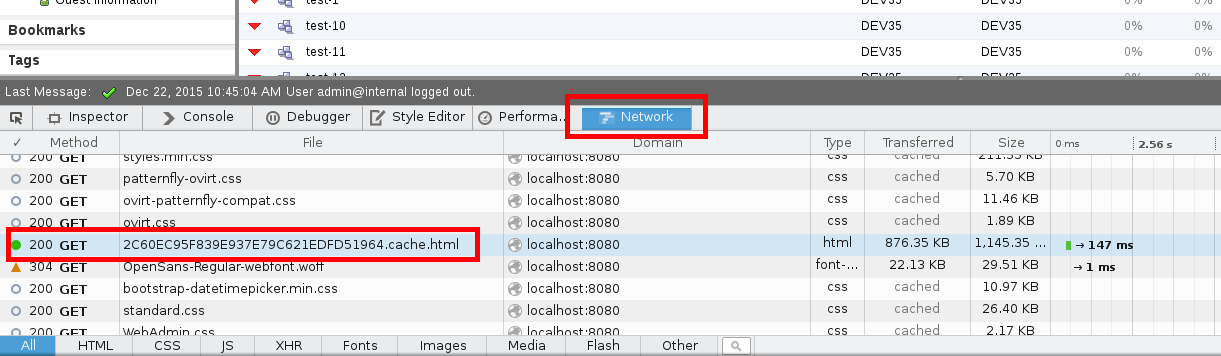
The way the UI is optimized it will generate one permutation for each combination of supported browser and supported locale. When you log into the web admin or user portal a script runs that determines which locale and which browser you are using, and loads the appropriate permutation for that combination. To determine which permutation you have loaded open up the developer tools in your browser again like above with CTRL+SHIFT+i. Then switch to the network tab as shown in the following diagram and look for the <permutation>.cache.html line.
Putting it all together
Now that you know which permutation you are using, open up the associated <permutation>.symbolMap with your favorite editor. Search for the symbol you found in step 1. This will look something like this:
Tjb,com.google.gwt.lang.ClassLiteralHolder::Lcom_google_gwt_event_dom_client_KeyEvent_2_classLit,com.google.gwt.lang.ClassLiteralHolder,Lcom_google_gwt_event_dom_client_KeyEvent_2_classLit,com/google/gwt/dev/jjs/intrinsic/com/google/gwt/lang/ClassLiteralHolder.java,23,-1
The part in this instance, that the developers are interested in is ClassLiteralHolder.java,23. This means that the symbol is defined in line 23 of the ClassLiteralHolder.java file. This will help them determine the source of the actual exception.