Profiling JavaScript
How to use JavaScript profilers to debug Admin or User Portal performance issues
Audience
This post is intended for frontend developers working on oVirt. You should be familiar with GWT and building ovirt-engine. See OVirt_Engine_Development_Environment for help with building ovirt-engine.
Background
Chrome and Firefox have built-in JavaScript profilers that can help us easily debug browser performance issues. This post will walk you through using them to find the source of a “non-responsive script” dialog. We’ll use a real example we encountered in oVirt.
Draft mode compile
First, we must compile ovirt-engine in “draft mode.” By default, the GWT compiler obfuscates both the JavaScript and CSS that it generates. Draft mode disables this obfuscation, making the JavaScript and CSS human-readable.
make clean install-dev PREFIX=$HOME/ovirt-engine DEV_EXTRA_BUILD_FLAGS_GWT_DEFAULTS="-Dgwt.userAgent=gecko1_8,safari" DEV_BUILD_GWT_DRAFT=1 BUILD_UT=0 DEV_EXTRA_BUILD_FLAGS="-Dgwt.compiler.localWorkers=1"
Now start ovirt-engine.
~/ovirt-engine/share/ovirt-engine/services/ovirt-engine/ovirt-engine.py start
Profiling
Let’s use Chrome. Firefox behaves almost the same way, so once you can do this in Chrome, it’s easy to replicate in Firefox.
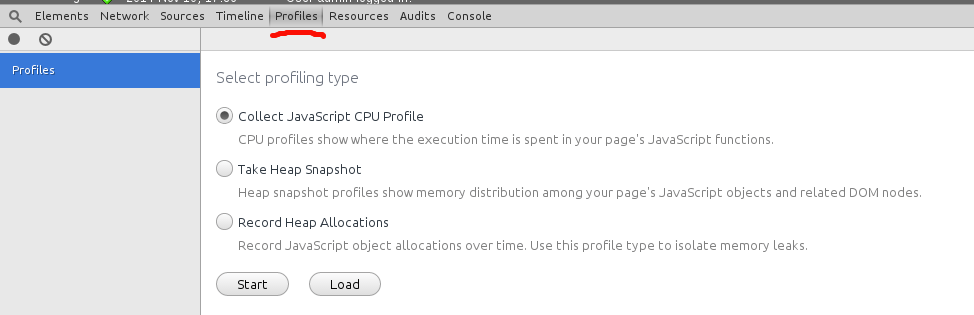
Start Chrome and hit F12. Click the Profile tab. Since we’re debugging JavaScript performance, we’ll use Collect JavaScript CPU Profile.
It’s best to start profiling right before we do the problematic operation in our application – that way, there will be less noise in our profiler data.
Browse to the application. Browse to the part of the application that is having problems. Don’t start the problematic operation just yet.
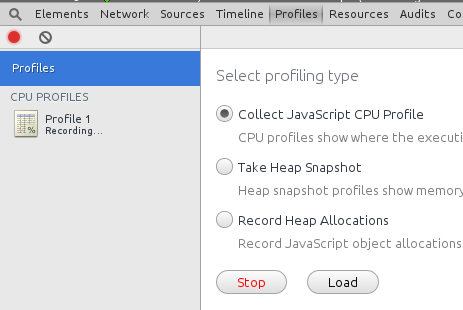
Click the record button in the Chrome profiler. It’s now profiling. Do the problematic operation. Hit the Stop button when you’re done. Wait a few seconds for the profiler to compile its data.
Viewing the profiler data
There are a few ways to view the data. If you just want to see where the most time was spent, use the Heavy view.
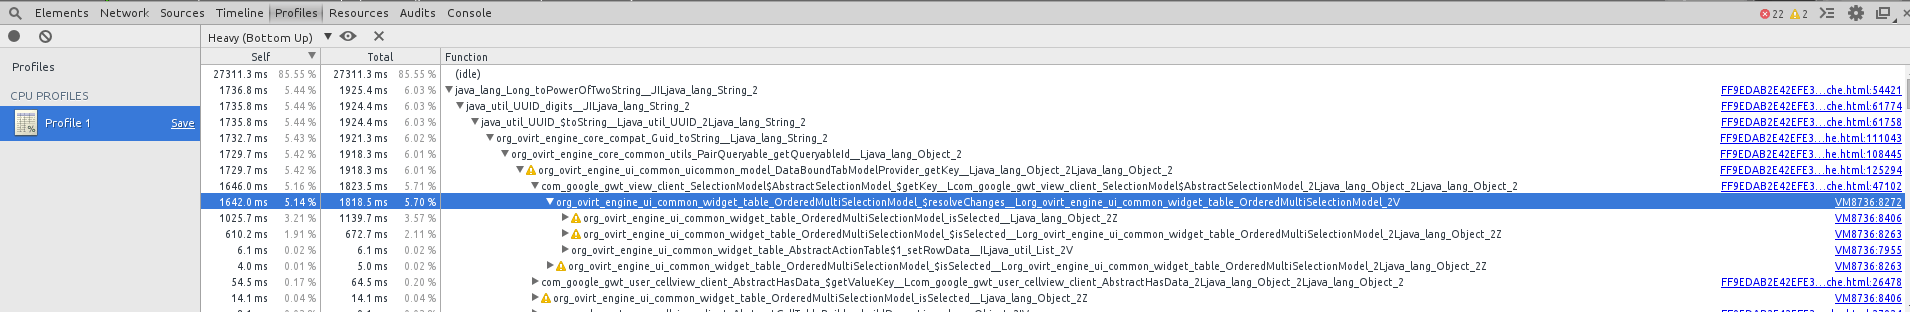
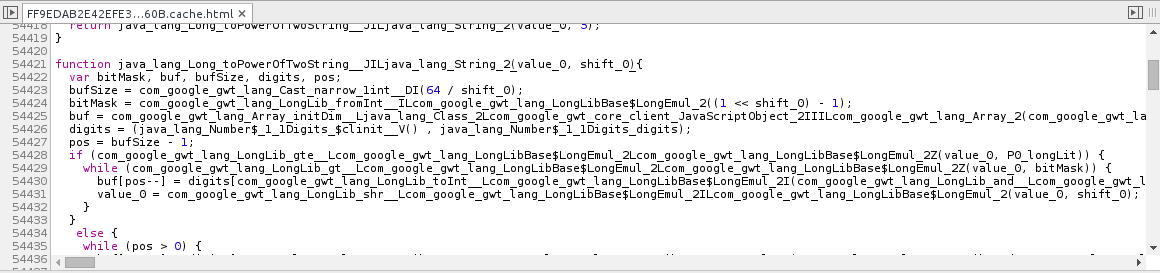
When running my example, the browser hung for about 2 seconds. Looking at my profiler data, it looks like the JavaScript engine spent a lot of time in the functions named “isSelected”, “resolveChanges”. The root cause appears to be a slow “toPowerOfTwoString” function.